I. INTRODUCTION
Baseball enthusiasts often are surprised to find that outcomes in their sport can (with surprisingly high accuracy) be described and regularly predicted by statisticians. In fact, properly used statistics can rather effectively describe outcomes in a variety of different sports. As long as there’s enough prior data to analyze, there’s almost always a way to roughly model behavior in games where participants aim to optimize their performance subject to the game’s rules. The United States Academic Decathlon, a nationwide academic competition for high school students, is no exception to this rule.
The aim of this paper is to create a rough model for the “behavior” of Academic decathlon teams; that is to say, a rough model to describe how they score in the year’s final competition based on their scores from previous meets in that season. I was, in the end, able to create a reasonably complete model – not as complete as I would like, unfortunately, due to a lack of certain data. The most important conclusion was that a team’s final score could be described as nearly memoryless; the final score is overwhelmingly dependent on the previous round’s score, but depends almost not at all on the round before that.
II. BACKGROUND
In the Academic Decathlon, schools across the nation send teams to compete in four rounds of competition – local scrimmages, regional elimination rounds, state elimination rounds, and a final national competition. Teams consist of three students each from three GPA ranges (varsity, scholastic, and honors), with the scores of the top two students in each range being added to create a cumulative team score. The competition itself consists of 10 tests, including seven multiple choice tests, an interview event, a speech event, and an essay event. The maximum score possible for each student is 10,000, making the maximum possible team score 60,000.
III. DATA
In order to collect data for this project, I copied data from the Academic Decathlon Scores and Information Center (ADSIC), a student-run information aggregate for all coaches and students interested in past scores for the competition. Where they lacked data, I pieced through newspaper archives and internet newsgroups to try and find as many scores as possible, with limited success.
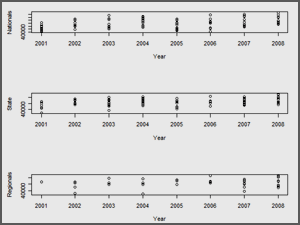
The data I aimed to collect consisted of three scores for each team in the final top 10 for each year: their nationals score, their state score, and their regionals score. While I was able to easily locate all nationals scores for every top-10 team in the last 8 years, I met with less success at tracking down state scores. Of the 80 teams in the top 10 from 2001 to 2008, I was able to locate 65 out of 80 (81.2%) of the teams’ state scores. I was completely at a loss to track down most of the regionals scores. Of the 80 top 10 teams, I was able to locate only a paltry 34 out of 80 (42.5%) of the teams’ regionals scores. For reasons that will be discussed later, however, this wasn’t as much of a problem as I thought it would be.
There was one other problem with data collection that kept me unable to do quite the in-depth analysis I’d have liked. It was my original goal to get full sets of team scores from every state. This way, I would have been able to calculate normalizing statistics to account for the fact that the subjectively judged events (interview, speech, essay) tend to be graded slightly differently from state to state and oftentimes slightly inflate or deflate team scores in their state. I was unable to get enough data to do this, however.
My data matrix consists of 80 rows. Each row represents a top 10 team’s performance during a given year; rows 1 through 10 describe 2008, rows 11 through 20 describe 2007, etc. There is a column for the score they received at nationals, a column for the score they received at state, and a column for the score they received at regionals. Beyond this, there are columns for the state’s “tier” (taking on the value of 2 if they are a top tier team that regularly is in the top 5 at nationals, 1 if they are regularly in the top 10, and 0 if they are not usually in the top 10), and columns that act as indicator variables for certain states (specifically California, Arizona, Illinois, Wisconsin, and Texas – these take on a value of 1 if the row is a school from that state, and 0 if they are not).
| Min. | 1st Q | Median | Mean | 3rd Qu | Max. |
|---|---|---|---|---|---|
| 40370 | 43480 | 45530 | 45910 | 48350 | 53120 |
Summary statistics for the State scores:
| Min. | 1st Q | Median | Mean | 3rd Qu | Max. | NA's |
|---|---|---|---|---|---|---|
| 37160 | 44020 | 45920 | 46030 | 48140 | 52880 | 15 |
Summary statistics for the Regionals scores:
| Min. | 1st Q | Median | Mean | 3rd Qu | Max. | NA's |
|---|---|---|---|---|---|---|
| 37230 | 44550 | 46420 | 46040 | 47950 | 52950 | 46 |

Click the graph to enlarge.

